Solar street lighting is attracting cities, campuses, estates, and remote communities seeking lower operating costs. Unlike conventional systems, these installations generate electricity beside the road. They can avoid trenching, cable purchases, and some grid connection charges. However, the investment is not automatically profitable. Panel size, battery quality, pole spacing, sunlight, and local labor rates can change the outcome significantly.
A practical evaluation begins with real site conditions. Experienced lighting engineers inspect shade, road width, nighttime activity, and seasonal weather. They also compare measured illumination with relevant project requirements. The financial model should include fixtures, foundations, batteries, transport, installation, inspections, and future replacements. How to calculate the ROI of switching to solar street lighting depends on these complete costs, not the equipment price alone. Annual savings may include electricity, cable maintenance, meter charges, and reduced fault visits. Reliable supplier warranties and documented battery-cycle data deserve careful attention.
The numbers can disappoint.
A solar system may perform poorly beside tall buildings or during extended cloudy periods. Battery replacement can also weaken an attractive payback estimate. For that reason, a responsible ROI study should test conservative, expected, and optimistic scenarios. It should record assumptions clearly and update them with local energy tariffs and maintenance records. A credible comparison also considers service continuity, carbon reduction, and safer nighttime visibility. These benefits matter, but they should not hide weak financial evidence. The strongest decision combines engineering inspection, transparent calculations, supplier verification, and honest reflection after installation. That approach turns a promising concept into a measurable infrastructure investment.
What Solar Street Lighting Includes and How It Works
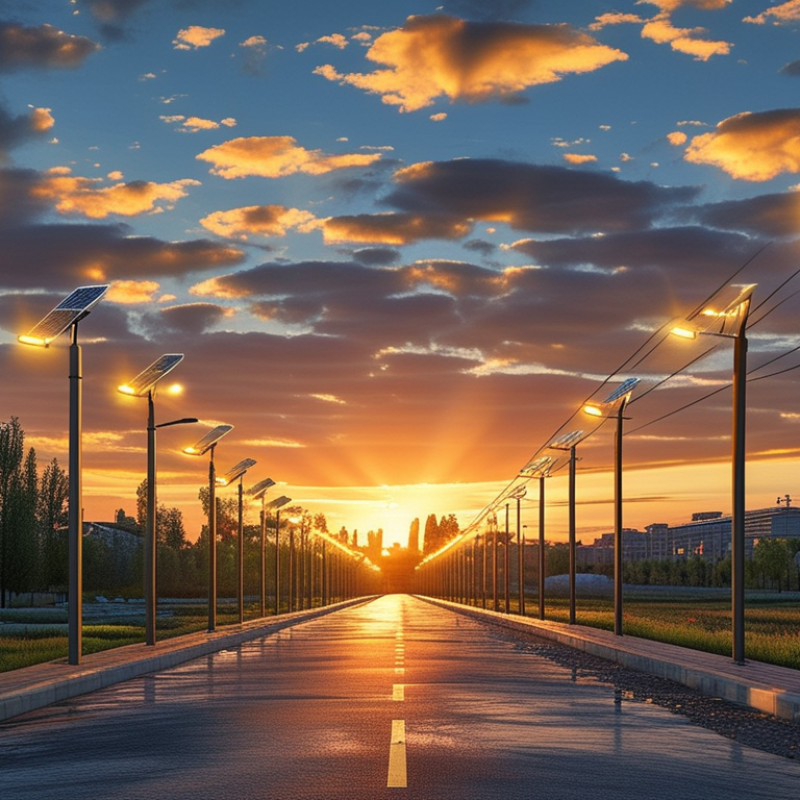
Solar street lighting is a complete off-grid lighting system, not merely an LED lamp with a solar panel. Each unit usually includes a photovoltaic module, charge controller, rechargeable battery, LED luminaire, pole, wiring, and dusk-to-dawn controls. During daylight, the panel converts sunlight into electricity. The controller stores that energy safely. After sunset, the battery powers the LED fixture.
A motion sensor can raise brightness when pedestrians or vehicles approach. Otherwise, the controller can reduce output and preserve battery capacity. This matters during cloudy periods. NREL’s PVWatts guidance recommends evaluating monthly solar production, not relying on annual averages. Battery sizing should consider the weakest solar month, local temperature, and required backup nights. Poor assumptions here can damage the expected ROI.
Modern LEDs use far less electricity than conventional outdoor lamps. The U.S. Department of Energy’s Solid-State Lighting R&D Opportunities report describes LED system efficacies above 100 lumens per watt. The IEA PVPS Trends in Photovoltaic Applications 2024 report recorded about 456 gigawatts of new global solar capacity in 2023. Solar lighting can avoid trenching, utility connections, and recurring electricity charges. However, batteries still require eventual replacement. Dust, shading, extreme heat, and weak maintenance planning can reduce performance. The design is not foolproof. A realistic payback model should include battery replacement, cleaning, outage risk, and illumination requirements.
What Is the ROI of Switching to Solar Street Lighting?
Ten-year lifecycle cost comparison for one 60 W street light operating 12 hours per night. This remote-site scenario assumes grid electricity at $0.15 per kWh, conventional installation with trenching at $3,000, solar installation at $2,200, annual maintenance of $60 for grid lighting and $25 for solar lighting, and one $300 battery replacement in year six.
Under these assumptions, solar street lighting costs approximately $2,750 over ten years compared with $3,994 for conventional grid-connected lighting. That represents about $1,244 in savings per light, or a 56.6% return relative to the solar system's initial cost. Solar lighting works by converting sunlight into electricity during the day, storing it in a battery, and powering the LED fixture automatically at night.
Key Costs Involved in Switching to Solar Street Lighting
Switching to solar street lighting begins with capital costs, not electricity savings. A typical project may include a site survey, solar panels, LED fixtures, batteries, controllers, poles, foundations, installation, transport, and commissioning. Battery capacity often drives the price. Designers must allow for cloudy days, night-time operating hours, and local temperature changes. Small errors here become expensive replacements.
The International Renewable Energy Agency reported a global weighted-average utility-scale solar PV cost of about $0.044 per kilowatt-hour in 2023. However, street lighting has separate costs because each pole needs its own storage system and controls. The U.S. Department of Energy reports that LED lighting can use at least 75% less energy than conventional lighting and last much longer. That improves operating economics, but it does not remove cleaning, inspections, vandalism protection, or battery disposal costs. Maintenance is still real.
Consider 100 lights operating 12 hours nightly. If each fixture uses 40 watts, annual consumption reaches roughly 17,520 kilowatt-hours. At $0.15 per kilowatt-hour, avoided grid energy costs about $2,628 yearly. This excludes demand charges and connection fees. A solar system costing $90,000 would show a simple energy-only payback near 34 years. That looks weak. Avoided trenching, cables, meters, and grid upgrades could materially change the calculation. The uncomfortable part is uncertainty: battery replacement timing, theft risk, and poor winter performance can quietly reduce ROI. A credible business case should test these variables, rather than advertise one optimistic payback period.
Methods for Measuring the ROI of Solar Street Lighting
Measuring the ROI of solar street lighting requires more than comparing purchase prices. Establish a clear baseline using existing electricity bills, maintenance records, outage logs, and lamp replacement costs. Record the full solar investment, including poles, panels, batteries, installation, permits, inspections, and future battery replacement.
Use this formula: ROI equals cumulative benefits minus total investment, divided by total investment. Express the result as a percentage. Also calculate the payback period in years.
Tips: Measure the same lighting route before and after installation. Track night-time energy use, repair visits, battery performance, and illumination levels. A simple monthly spreadsheet can reveal seasonal differences. Do not rely only on projected savings. Field conditions often change them.
A reliable assessment should cover at least five to ten years. Include avoided grid electricity costs, reduced cable work, lower maintenance hours, and fewer service interruptions. Attach monetary values to improved lighting only when the method is transparent and defensible. For technical evidence, use light-level readings at fixed points and inspect several nights during cloudy periods. Ask an independent electrical professional to review the assumptions. The calculation may still be imperfect. Battery ageing, vandalism, shade, and unexpected repairs can weaken the forecast. Run conservative, expected, and optimistic scenarios before approving the project.
Factors That Influence Payback Periods and Long-Term Value
Solar street lighting can reduce electricity bills, trenching costs, and grid dependence. Yet its ROI is not automatic. It varies. The payback period depends on more than panel output. A reliable calculation compares purchase, installation, battery replacement, inspections, and avoided utility charges. It should also include the value of uninterrupted lighting in remote areas. That value is harder to price.
Solar exposure is a major variable. Shaded roads, dusty panels, and winter weather reduce daily energy harvest. Battery chemistry, capacity, and operating temperature also affect service life. A lamp beside a bright intersection may need less output than one covering a dark rural bend. Pole spacing, traffic patterns, and required lighting levels must be measured on site. Professional audits should use local solar data, load profiles, and realistic maintenance schedules. Inflated assumptions create attractive spreadsheets, not dependable savings.
Long-term value improves when components are modular and accessible. Technicians can replace a controller or battery without removing the entire pole. Warranty terms, spare-part availability, theft protection, and disposal costs deserve equal attention. A five-year forecast may look impressive, while a twelve-year battery replacement changes the result. This is where many proposals feel incomplete. Sensitivity testing helps. Test lower sunlight, higher labor rates, and earlier battery failure. The best decision may not deliver the fastest payback. It may deliver steadier service, fewer excavations, and predictable operating costs over the lighting system’s full life.
What Is the ROI of Switching to Solar Street Lighting? Factors That Influence Payback Periods and Long-Term Value
| Project Scenario |
Solar System Cost per Light
(USD) |
Conventional LED Cost per Light
(USD) |
Avoided Grid Infrastructure
(USD per Light) |
Net Solar Premium
(USD per Light) |
Annual Operating Savings
(USD per Light) |
Expected Battery Replacement |
Simple Payback Period |
20-Year Net Benefit
(USD per Light) |
20-Year ROI |
Main Value Driver |
| Urban Retrofit |
$5,000 |
$2,800 |
$800 |
$1,400 |
$156 |
Approximately $1,500 in Year 10 |
9.0 years |
$220 |
15.7% |
Reduced electricity and routine maintenance costs |
| Rural New Installation |
$5,200 |
$3,000 |
$4,500 |
Solar saves $2,300 initially |
$156 |
Approximately $1,500 in Year 10 |
Immediate |
$3,920 |
Not applicable because solar has a lower initial project cost |
Avoided trenching, cabling, and grid connection work |
| Remote or Off-Grid Location |
$6,000 |
$3,500 |
$12,000 |
Solar saves $9,500 initially |
$156 |
Approximately $1,800 in Year 10 |
Immediate |
$10,820 |
Not applicable because solar has a lower initial project cost |
Elimination of long-distance power extensions and utility dependence |
| High-Electricity-Tariff Area |
$5,000 |
$2,800 |
$800 |
$1,400 |
$221 |
Approximately $1,500 in Year 10 |
6.3 years |
$1,520 |
108.6% |
Higher avoided electricity costs accelerate payback |
|
Calculation basis:
Illustrative 2026 USD model for one street light operating 12 hours per night, or approximately 4,380 operating hours per year. The conventional system assumes a 100-watt LED fixture, annual electricity use of approximately 438 kWh, and electricity priced at $0.15 per kWh in standard-tariff scenarios or $0.30 per kWh in the high-tariff scenario. Annual operating savings include estimated electricity savings and approximately $90 in avoided routine maintenance. Solar battery replacement is modeled once during the 20-year period. Actual results vary with solar radiation, lighting schedules, equipment sizing, local labor rates, electricity prices, maintenance practices, financing costs, and project-specific grid-extension requirements.
|
|
Formula:
Net solar premium = Solar system cost − Conventional LED cost − Avoided grid infrastructure. Simple payback = Net solar premium ÷ Annual operating savings. 20-year net benefit = Avoided initial infrastructure and operating costs − Solar premium − Battery replacement cost.
|
Conclusion
Switching to solar street lighting involves replacing conventional grid-connected fixtures with integrated systems that typically include solar panels, batteries, LED lamps, controllers, poles, and monitoring components. During daylight, the panels generate electricity and store it in batteries for nighttime use, reducing dependence on utility power. The main costs include equipment, site preparation, installation, maintenance, battery replacement, and possible upgrades to existing infrastructure.
The financial and operational benefits can include lower electricity bills, reduced trenching and cabling expenses, fewer service interruptions, and simpler maintenance in remote areas. How to calculate the ROI of switching to solar street lighting depends on comparing the total upfront and ongoing costs with annual energy, maintenance, and operational savings over the system’s useful life. Payback periods and long-term value are influenced by sunlight availability, lighting demand, battery performance, equipment quality, installation conditions, local energy prices, and financing terms. A complete evaluation should also consider reliability, emissions reductions, safety improvements, and the expected replacement cycle of major components.

 Lumina Light